 Unoptimized application flamegraph. Highlighting the template autoescape stack.
I did two flamegraphs profiling a simple Ringo web app and an optimized version of the same app.
What an awesome visualization tool! I'll definitely create a flamegraph next time I need to profile something.
The tree visualization encouraged me to think about what actually triggers code to get executed and why some frames sometimes go into wide plateous (which is bad) and at which point I could most easily cut of such mountains.
One glaring example is Reinhardt's autoescaping feature.
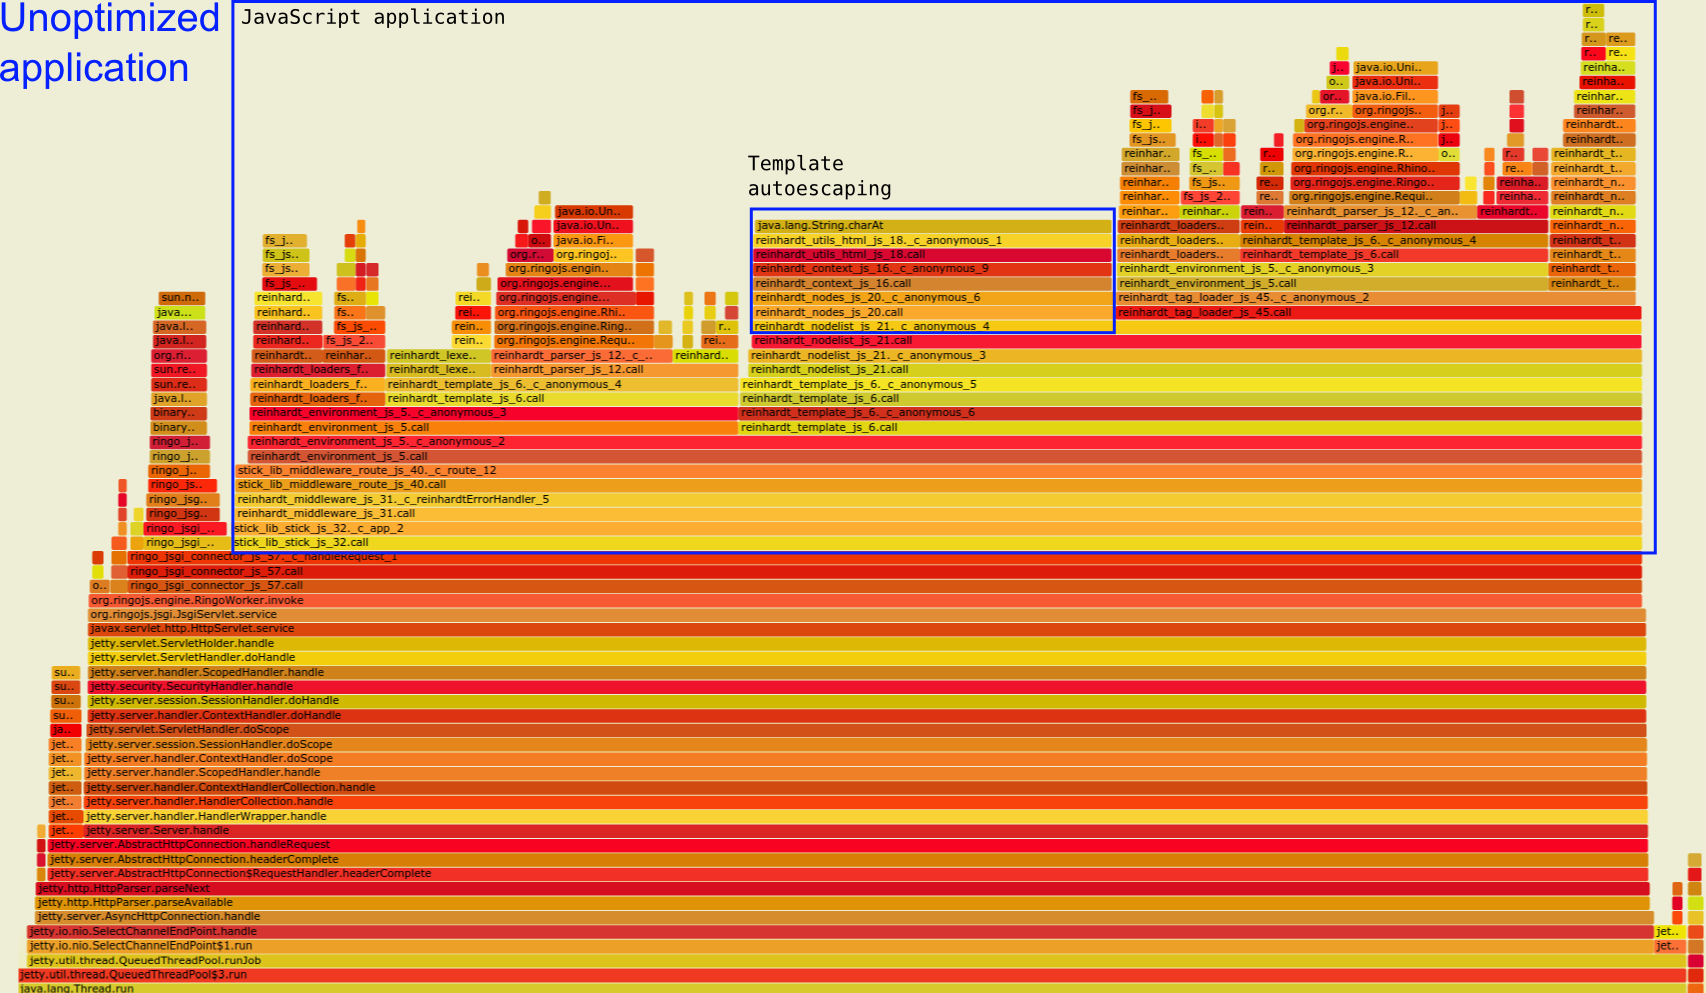
In the unoptimized app, autoescaping is a wide plateau in the middle of the graph. You can see it below labeled as "Template autoescaping" within the bigger block of the JavaScript application:
Unoptimized application flamegraph. Highlighting the template autoescape stack.
Autoescaping requires that Reinhardt matches every string against a regex to get rid of possible injections. The cost of autoescaping is clearly visible as a wide plateau in the graph above.
Compare the above graph with the optimized version below. I disabled autoescaping (among other things). The autoescaping plateau is completely gone. Due to this and other optimization, we now see less than 30% of the total time is spent in the applicaton's JavaScript code compared to 80% in the original application. Now, for the most part we see JSGI and Jetty writing responses.
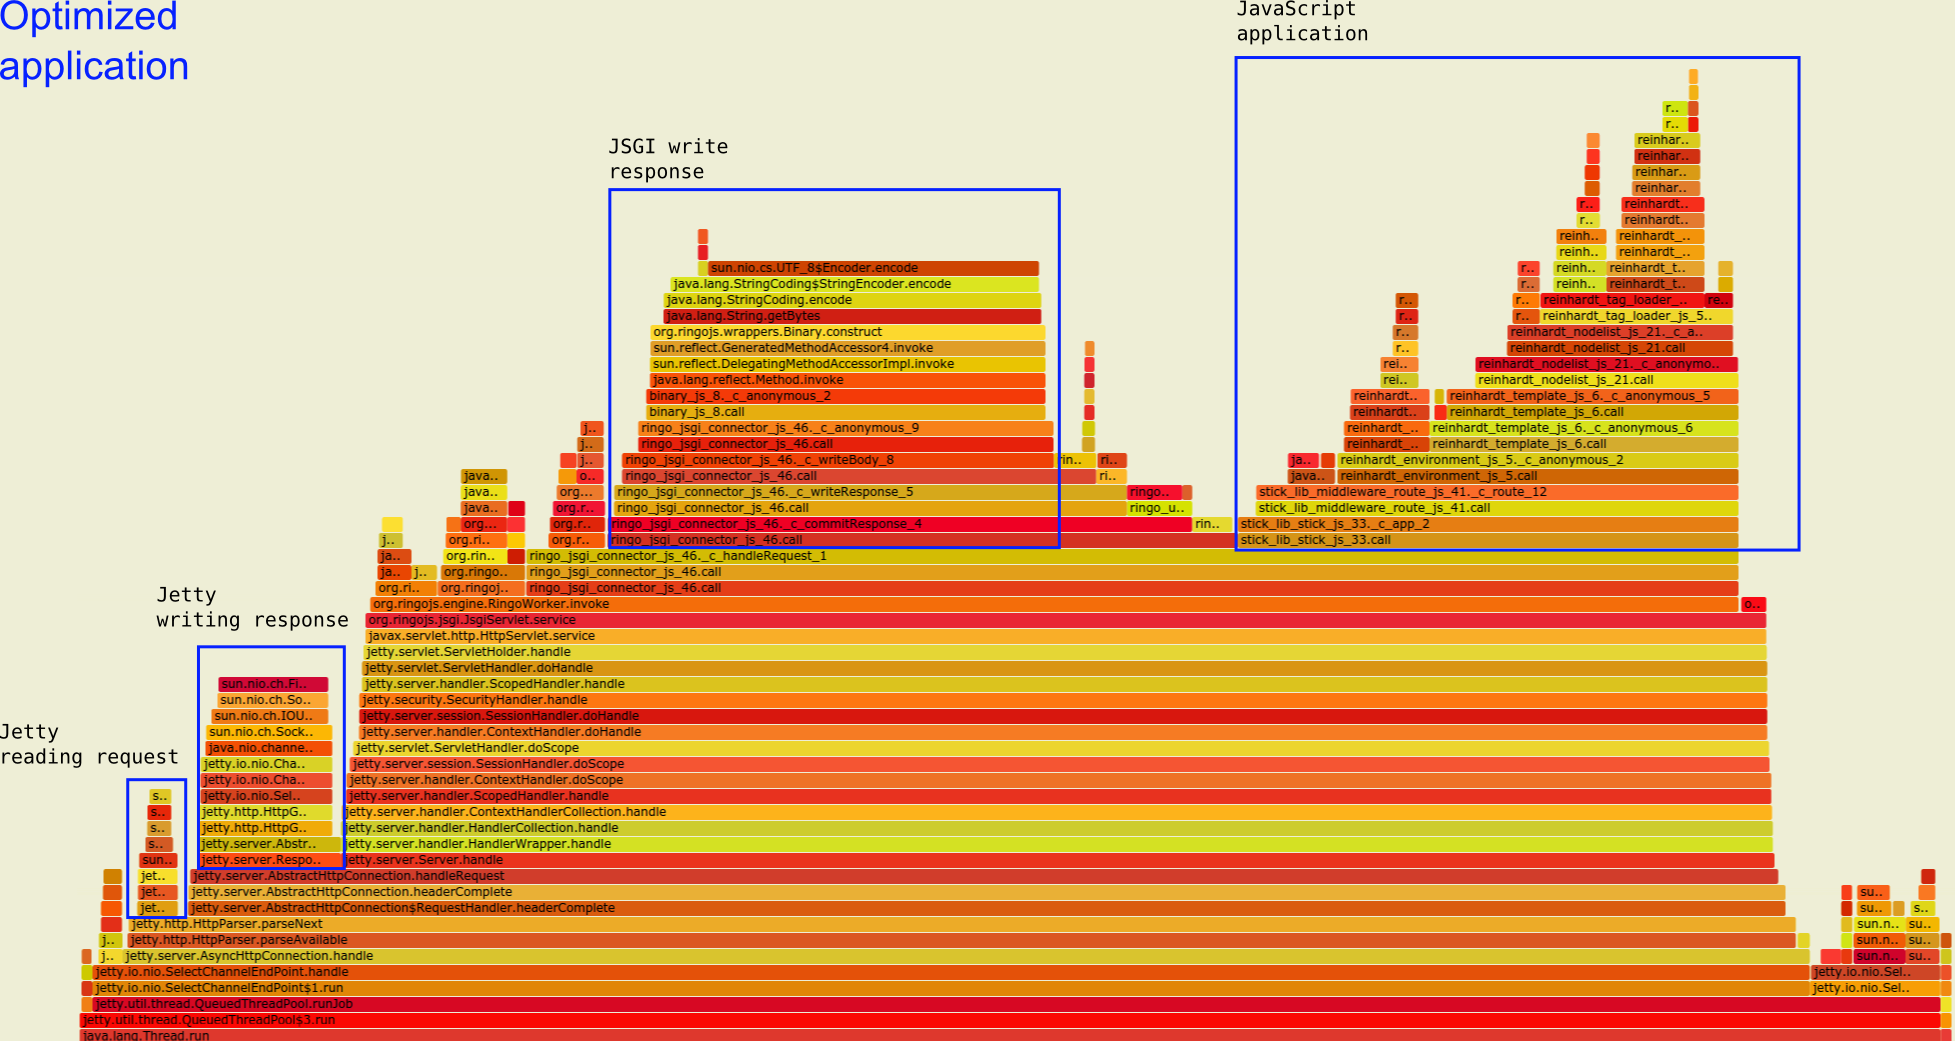 Optimized application flamegraph: more time is spent writing the response instead of generating it in JavaScript.
Below are the two links to the full SVG flamegraph files. The SVG allows you to double click on part of a stack to zoom in on it:
I'll annotate the two flamegraphs to make clearer what's going on. The optimization clearly changes which code paths are hot. Some traces dissapear completely from the sampling.
The profiled code is the example application for Reinhardt and as such it is tuned for easy development and not speed. Thus, it was an easy target to optimize and the tweaks made are fairly obvious; this isn't about tricky optimizations but should give an example of how to interpret a Ringo flamegraph.
If you don't know how to read flamegraphs, the flamegraphs website provides a useful summary:
The colors aren't significant, and are usually picked at random to be warm colors.
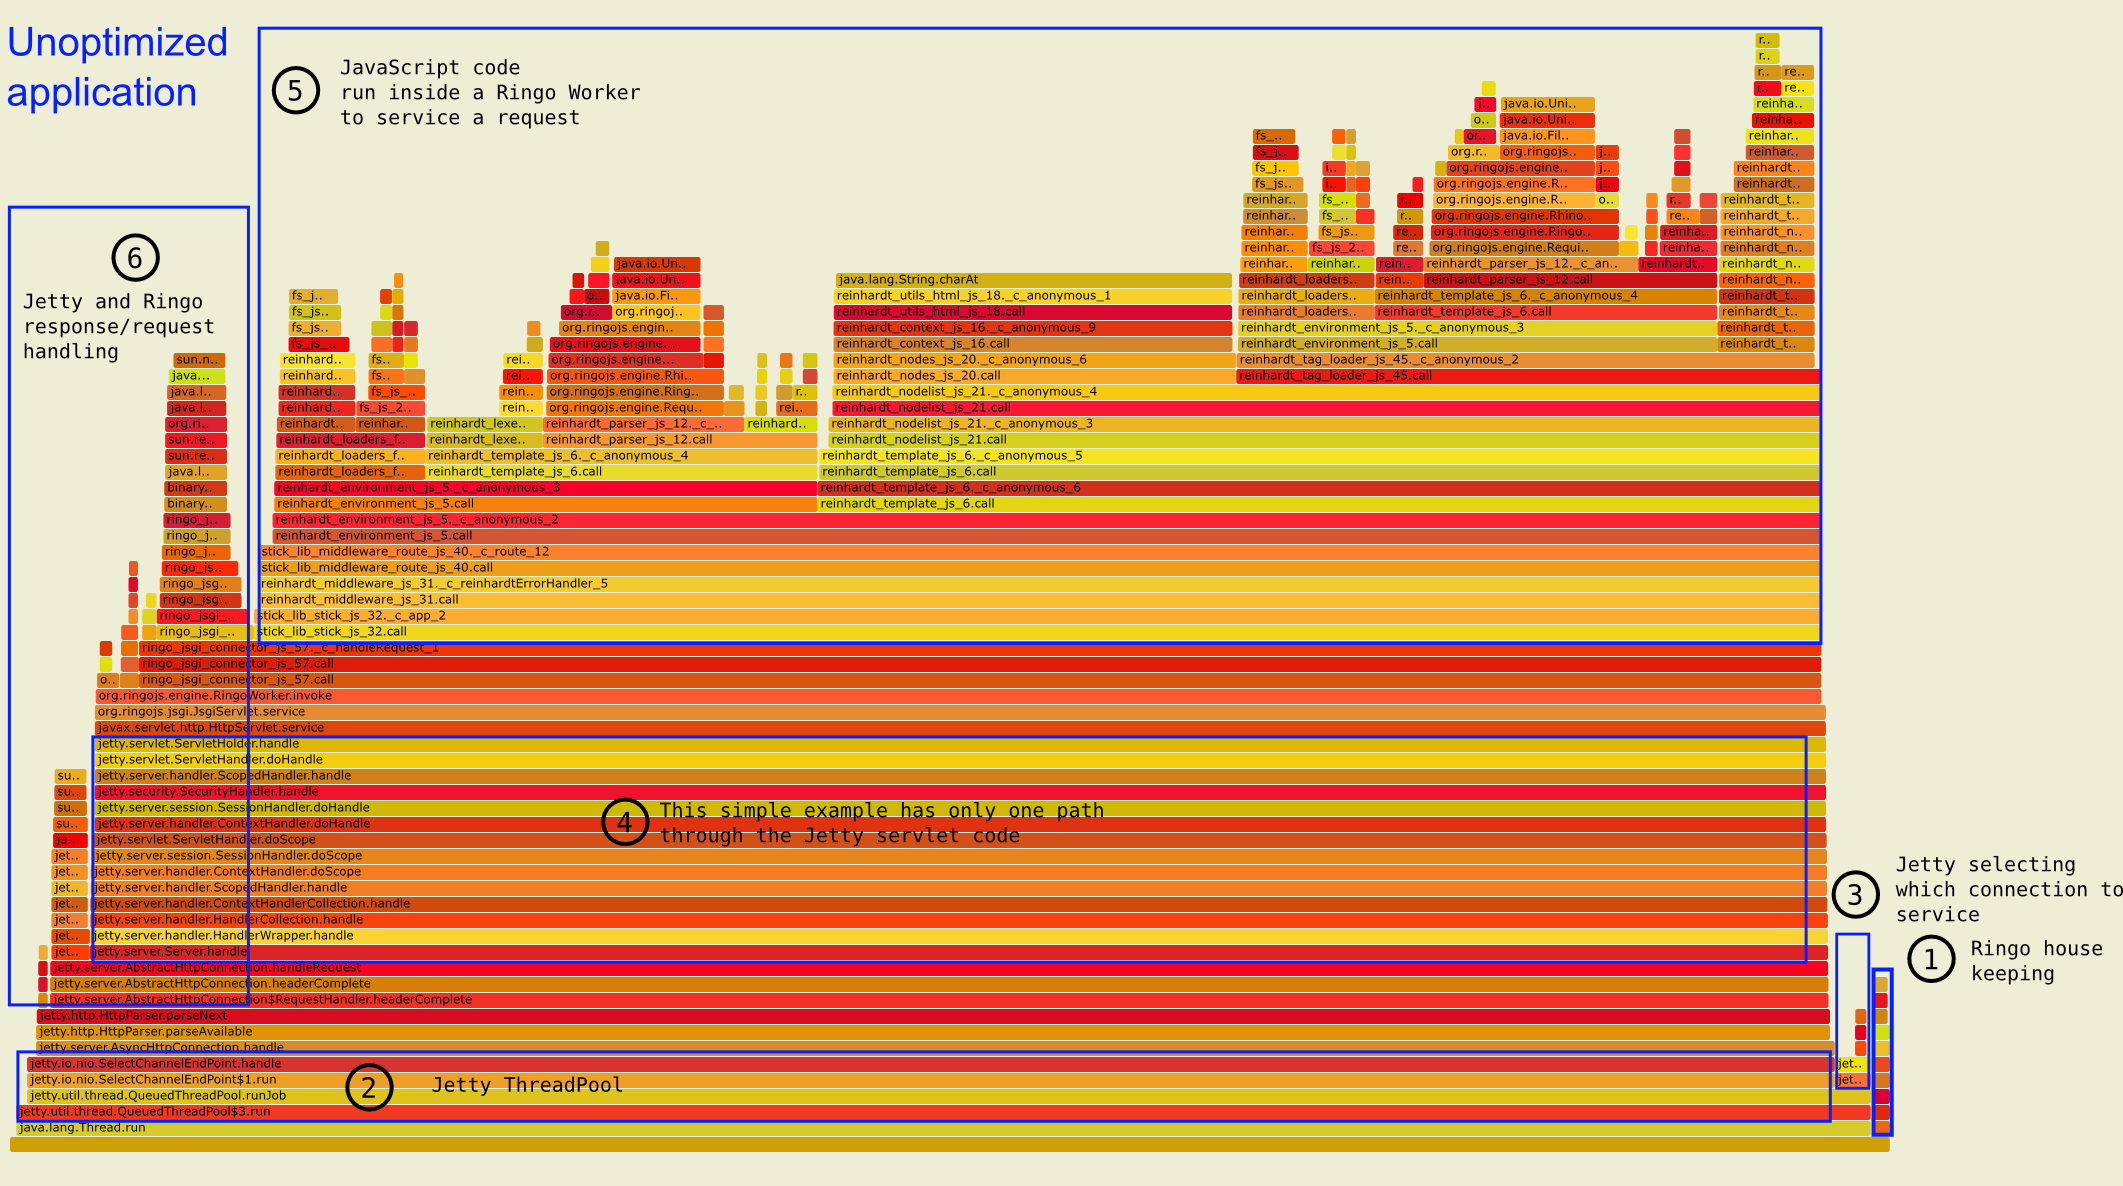 Unoptimized application: main areas of computation annotated
Looking at the overall graph, six types of stack traces can be distinguished. Going from right to left, we see:
RingoWorker.invoke is called, we are in JavaScript land.By default, the Reinhardt template engine will read the template from disk, then split the string into semantic chunks. The chunks are interpreted by a parser assembling the actual template function. Rendering the template is done by simply calling the template function with a rendering context.
The optimized version uses a cached loader which performs all steps except rendering only once for each template. After the first request, the template function is cached in a ConcurrentHashMap and filesystem loading, lexing and parsing are no longer performed. Note that I do not cache the result of passing the context to the template function; the template is rendered in both versions.
Additionally, I disabled autoescaping. Autoescaping helps to prevent XSS attacks but it has significant performance costs: every string must be checked for unescaped HTML/XHTML tags and additionally checks are necessary to prevent double-escaping.
In the default application, most time is spent running code in JavaScript, particularly in the template system. All steps from [1] to [5] are related to templating. That's not surpising because the Reinhardt example application contains only one line which renders a template with a predefined context. Everything the application does, is this:
templates.renderResponse('base.html', context);
One oddity in the graph is that the first three template steps are present twice: loading [1], lexing [2] and parsing [3] are the steps taken to render a template. But due to template inclusion, the sub-template triggers the same first three steps: [1b], [2b] and [3b]. Autoescaping [4] and rendering [5], on the other hand, are only done once for the final template function.
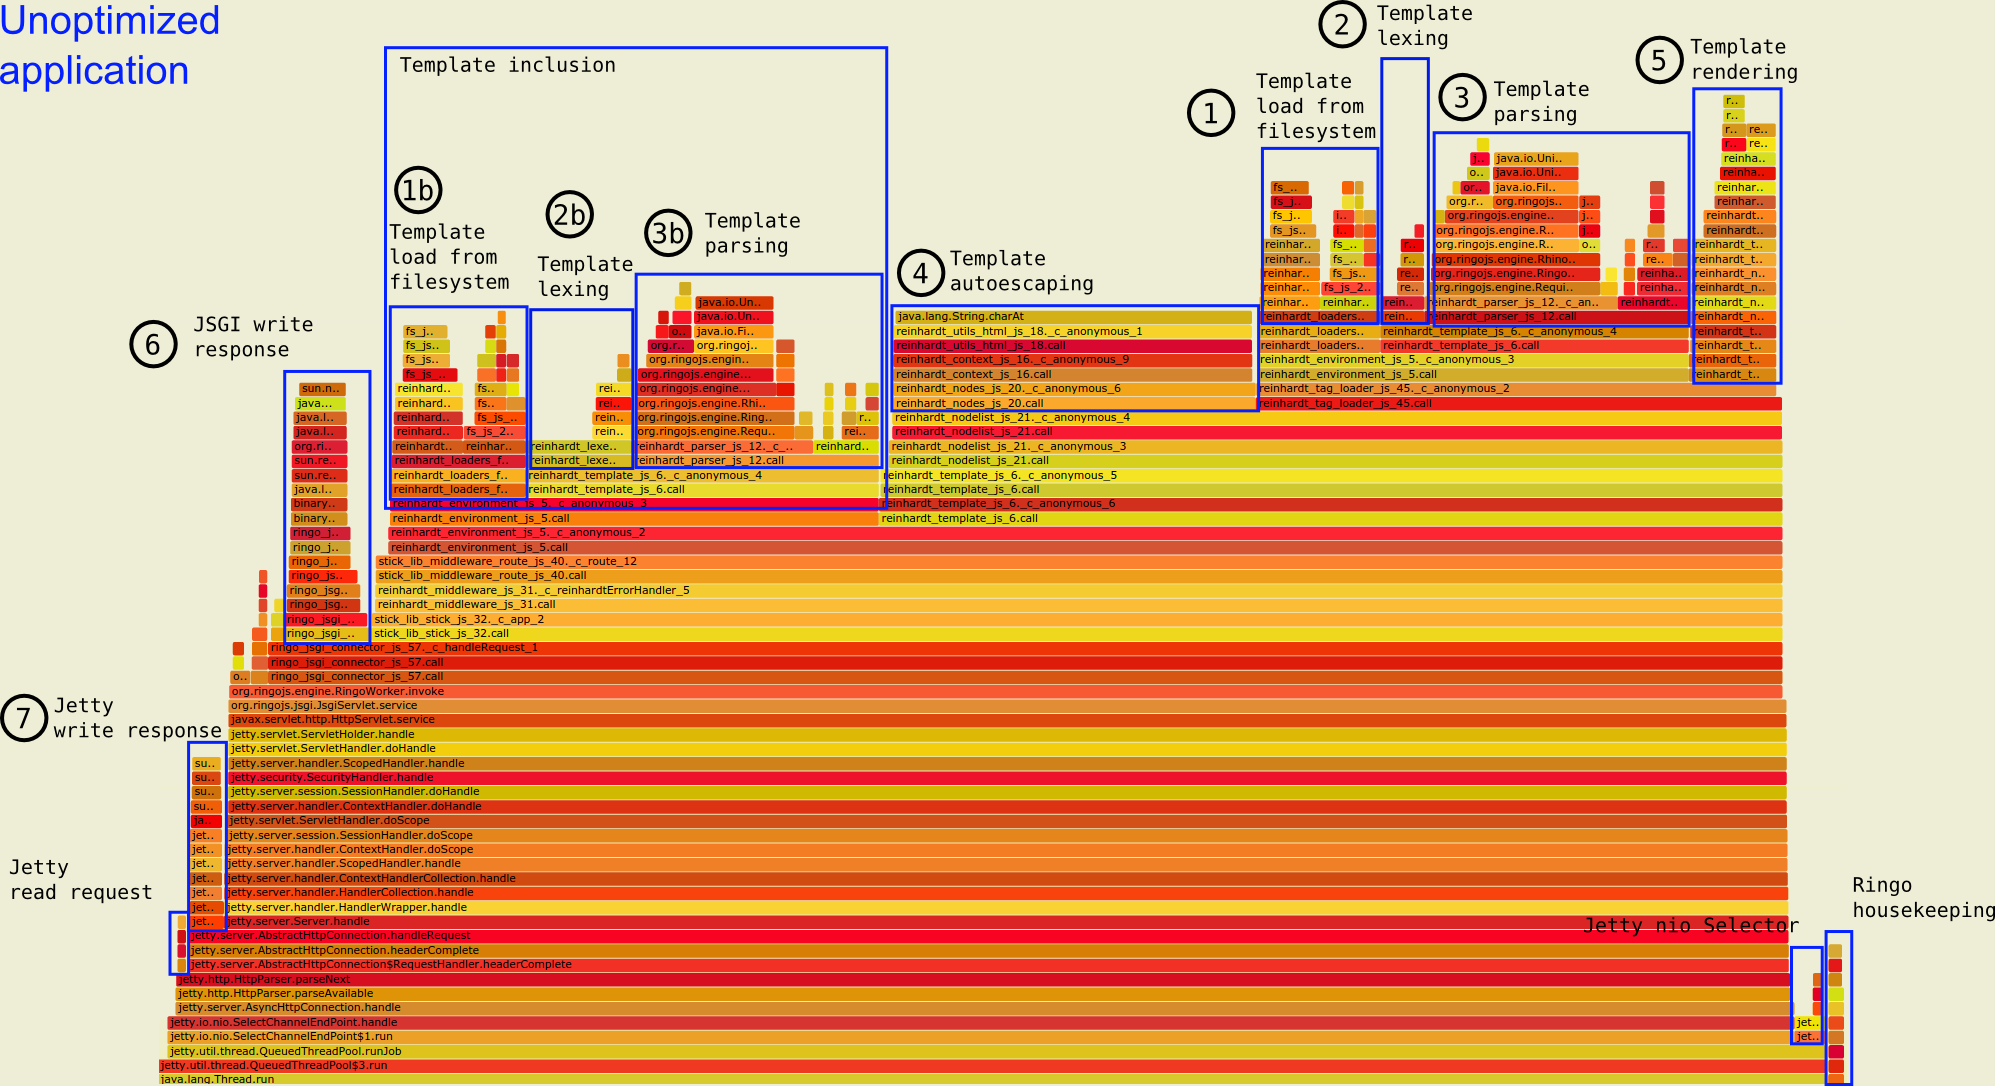 Unoptimized application, detailed annotation of computation areas
Also in the unoptimized app, we can easily see the autoescaping feature. It's a wide plateau in the middle of the graph [4].
What we would want for better throughput, is less time spent executing JavaScript to figure out which bytes to send as a response. Jetty and JSGI should be writing responses most of the time. Subsequently, if we get faster servicing of connections, new requests should arrive faster, which would require more network reading by Jetty.
Enter the optimized version:
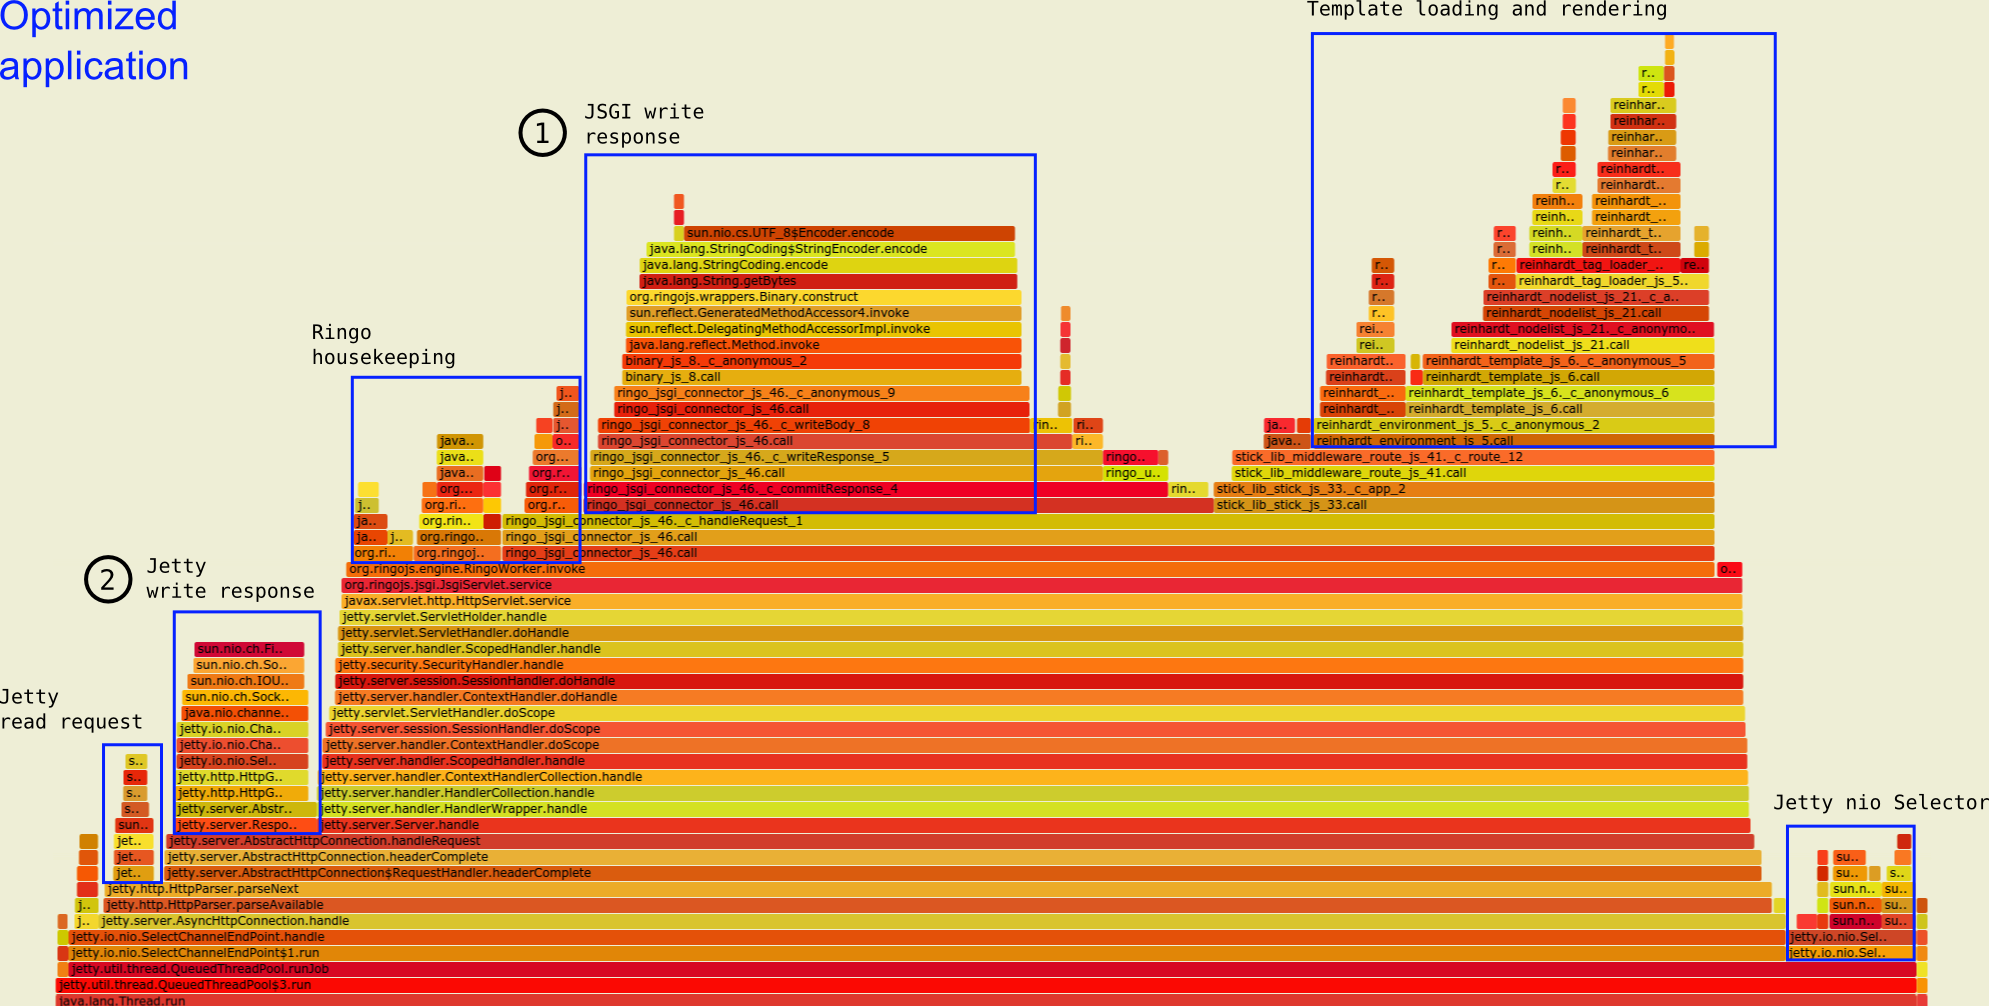 Optimized application, detailed annotation of computation areas
In the optimized version, the lexing and parsing steps are no longer visible (they only happened once) and most time is spent in our containers writing out the response bytes ([1] and [2]). This is good! The tasks "ringo housekeeping" and "jetty nio selector" now look wide and expensive but this was expected: the less time we spend running JavaScript, the more the containers around it will act and become visible in the sampling.
Both runs were performed with the following wrk call: ten connections are kept open, all connections are asynchronously handled by one thread. The benchmarks ran for 120 seconds without warmup (JVM warmup gives better performance).
./wrk -c 10 -d 120 -t 1 --latency http://localhost:8080
This setup kept one of my four CPU cores busy with wrk and Java's load was between 1.5 and 2.5. My RAM usage was always below 10%. I didn't want to saturate any part of my machine.
I replaced or removed some parts of the stack traces to make it more readable. Note especially how all calls to Rhino scriping ('org.mozilla.javascript'), which is the glue between our JS code and Java, are completely removed:
I also removed stack traces for which I recieved less then 10 samples to draw a cleaner picture.
Simon Oberhammer, 05/Jan/2015